Median, Range and Spread: Skip the Formulas, Picture the Numbers
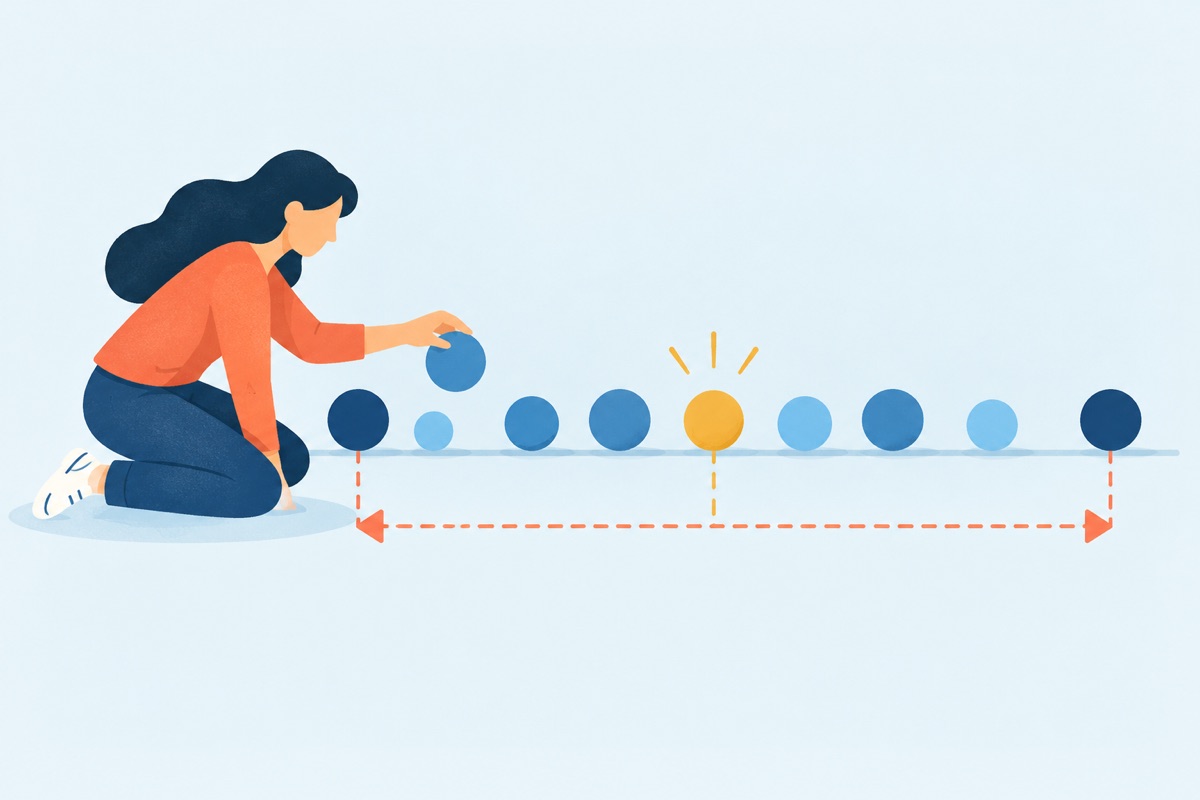
Every week I watch the same thing happen. A Test Taker sees the word median in a question, maybe standard deviation right after it, and their shoulders go up. They start digging through memory for a formula. Ninety seconds later they're still digging. And the whole time, the answer was sitting right there. All they had to do was write the numbers down in order and LOOK at them.
Here's my blunt verdict: median, range and spread questions are not formula questions. They're picture questions. If you can line up dots on a line and watch what happens when one dot moves, you can handle almost everything the GMAT throws at you on this topic. I'll bet the last median question you got wrong took you MORE than two minutes. And I'll bet the reason wasn't hard math. It was math done in your head.
Three words, three pictures
Before we go further, let's make sure the words are clear.
- Median is the middle number once the list is in order from smallest to largest. If the list has an even count, there are two middle numbers, and the median is their average.
- Range is the biggest number minus the smallest number. That's it. Nothing in the middle matters.
- Spread (the GMAT's formal name for it is standard deviation) is how far the numbers tend to sit from their average. Tight cluster, small spread. Scattered all over, big spread.
Notice that every one of those is something you can SEE. A middle dot. Two end dots. How bunched up the dots are. That's your whole toolkit.

Where these show up now
On the GMAT Focus Edition, you'll see these ideas in two places. The Quantitative Reasoning section gives you 21 Problem Solving questions in 45 minutes. Problem Solving just means a regular question with five answer choices. Then the Data Insights section, also 45 minutes, includes Data Sufficiency, where you don't solve the problem at all. You decide whether the facts you're given are ENOUGH to solve it. Statistics questions love both formats, because both reward the person who sees the structure over the person who grinds.
Watch the middle move
Let's do one. Notes on paper, please. Not in your head.
The mistakes I see over and over
- Finding the median of an unsorted list. The question gives you 14, 3, 9, 22, 6 and you grab the 9 because it's in the middle of the sentence. INSTEAD: Rewrite every list in order on your paper before you do anything else. Every time. Even when it looks sorted.
- Treating median and average as the same thing. They're not. The list 1, 2, 30 has a median of 2 and an average of 11. INSTEAD: Ask which one the question wants, and write that word at the top of your notes.
- Forgetting the even count rule. Six numbers have no single middle. INSTEAD: Count the terms first. If the count is even, circle the two middle numbers and average them.
- Overthinking range. People start worrying about the middle values when range only cares about the two ends. INSTEAD: Find the smallest and the largest. Ignore everything else.
- Reaching for the standard deviation formula. If you're grinding squares and square roots, you're working the long way. INSTEAD: Picture the dots and ask: did they spread out, bunch up, or just slide over?
This is the same idea as when we tell you to build the table before you touch an equation on rates questions. Get the information onto paper in a shape you can see. The picture does half the work for you.
Spread without the formula
Here are the moves that cover most spread questions. Picture each one before you read the result.
- Add or subtract the same amount to every number. The whole cluster slides over together. The spread does NOT change. The range does NOT change. The median and average move by that amount.
- Multiply every number by the same positive number. The dots stretch apart (or squeeze together if you multiply by a fraction). Spread and range change by that same factor.
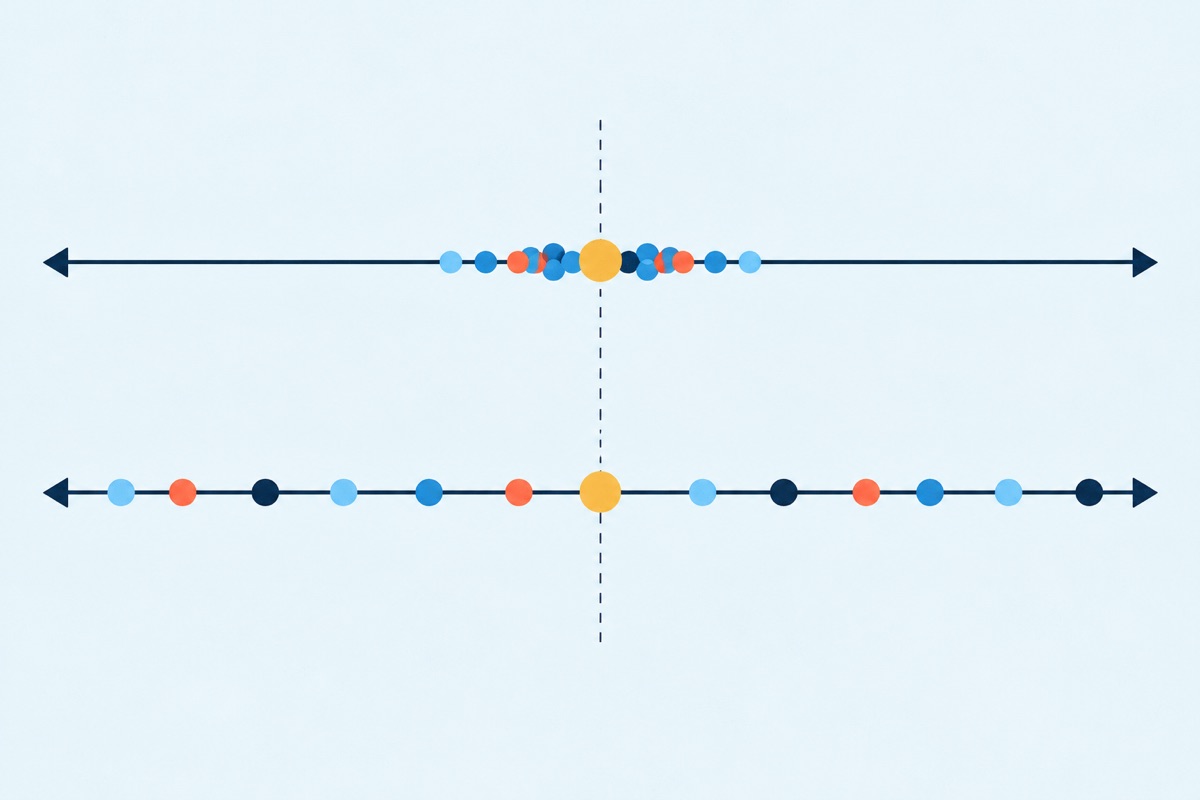
- Add a new number right at the average. You're adding a dot in the center, so the group gets tighter on average. Spread shrinks, or stays at zero if every number was already the same.
- Add a new number far from the average. One dot way out on the edge. Spread grows.
Stop and test yourself. Which has the bigger spread: 10, 10, 10, 10 or 1, 10, 19? Don't calculate. Picture it. The first list is four dots stacked on one spot, so the spread is zero. The second list has dots 9 away on each side. That one's bigger, and you didn't need a single square root to know it.
Now try one in Data Sufficiency
In Data Sufficiency, you get a question and two statements. You're not looking for the number. You're deciding whether the statements give you enough to answer for sure.
Your move
Here's what you do today. Pull three statistics questions you've already missed from your practice. Redo each one with one rule: the first thing on your paper must be the list, written in order, as dots or numbers. No formula until you've looked at the picture. Time yourself. Then compare that time to the time you took the first round. If the second round wasn't faster AND cleaner, look at your paper and tell me what's missing. You're not allowed to say "I have no idea."
If you want more fresh questions to train on, the official practice materials are the place to get them. Just remember: a question you redo until it's automatic is worth more than ten you glance at once.