Graphics Interpretation: The Dropdown Tells You What Math to Do
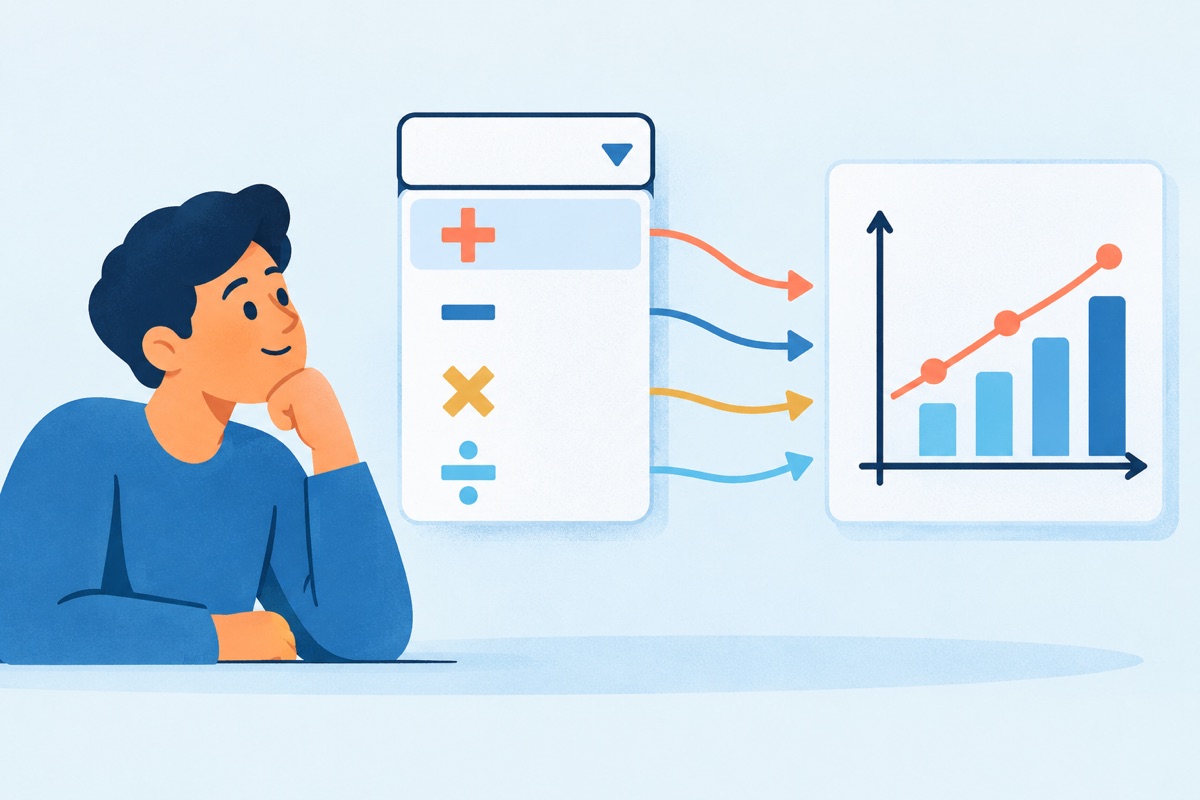
Here is a mistake I watch people make every single week. A Graphics Interpretation question loads. There is a bar chart with six colors, a legend, two axes and a footnote. The test taker studies it. Every bar. Every label. A full minute later, they finally read the sentence under the graph and find out it only asks about TWO bars.
That minute is gone. The Data Insights section does not give it back.
Here is my verdict: reading the graph first is a TERRIBLE habit. It is also very easy to fix.
What you are actually looking at
Graphics Interpretation is one of the five question types in the Data Insights section of the GMAT Focus Edition. You get one graph or chart. Under it sit one or two sentences with blanks in them. Each blank has a dropdown. A dropdown is a short menu of choices, and you pick the one that makes the sentence true.
Data Insights gives you 20 questions in 45 minutes, according to GMAC's page on the exam format. That works out to a little over 2 minutes per question, on AVERAGE. You share that clock with Data Sufficiency, Table Analysis, Multi-Source Reasoning and Two-Part Analysis. Every second you spend "getting to know" a graph is a second you steal from a question later in the section.
The dropdown is a confession
The question writer has to show you the choices. They cannot hide them. And the choices give away the job.
Stop reading for a moment and think about this. Say a dropdown offers 10%, 25%, 50%, 75% and 150%. Before you look at the graph at all, what kind of math are you about to do? And how exact does it need to be?
Don't read on until you have an answer.
You are about to find a percent. The choices are far apart, so a rough number will land on the right one. You do not need careful arithmetic. You need a fast estimate and a clean setup on paper.
Now say the dropdown offers "increased", "decreased" and "stayed the same". How much math is that? NONE. You only need the direction of a line.
That is the whole idea. Read the menu first and it tells you three things: what to calculate, how exact to be, and which tiny part of the graph matters.

What the menu is telling you
- Percents that are far apart: percent change or percent of a total. Estimate.
- Percents that are close together (say 21%, 23%, 25%): same math, but now you must read the graph carefully and do the arithmetic on paper.
- Ratios like 1 to 2 or 2 to 3: divide one value by another. Watch which one goes on top.
- Whole counts like 2, 3, 4, 5: you are counting things on the graph. No arithmetic at all.
- Words like increased or decreased, positive or negative: direction only. Look at the slope, not the numbers.
- The phrase "closest to" in the sentence: the writer is TELLING you to estimate. Believe them.
So you have to decide what you want MORE: to understand the whole graph, or to earn the point? The GMAT only pays for the second one.
The mistakes, and what to do INSTEAD
Studying the whole graph before reading the question. It feels responsible. It is actually a waste. You cannot know what matters until you know what is being asked.
INSTEAD: Read the sentence and its dropdown first. Then go to the graph with a specific target, like "Week 4 and Week 6".
Doing exact math when the choices are miles apart. If the choices are 10% and 50%, there is no reward for getting 49.7% instead of "about half".
INSTEAD: Look at how far apart the choices are. Far apart means estimate. Close together means slow down and compute on paper.
Skipping the axes and the labels. The dropdown tells you WHAT to find. It does not tell you whether the scale is in thousands or whether a bar shows a percent or a count. That part is on the graph.
INSTEAD: Once you know your target, read the axes for that part of the graph before you pull a single number off it.
Doing it all in your head. I'll bet that on your last practice set, at least one Graphics Interpretation miss came from flipping a ratio or reading the wrong bar, not from "hard math". Go check. Those are note-taking mistakes.
INSTEAD: Write the setup before you touch the graph. Two values, labeled, and the formula. It takes a few seconds and it kills the 150% trap every time.
Ignoring the trap choice. Wrong choices in a dropdown are not random. They are the answers you get from the most common slip.
INSTEAD: After you pick, ask: "What mistake would give me each of the other choices?" If your answer matches one of those mistakes, recheck. This is the same "set it up first, then think" habit that works in Table Analysis.
Why this is not a math skill
Nothing in that example was hard math. Subtraction, one division, a little counting. The people who miss it are not missing it because they can't divide. They miss it because they read in the wrong order, worked in their heads, and trusted a glance.
That is GOOD news. Reading order is a habit, and habits are trainable. The GMAT is a predictable, standardized test. Graphics Interpretation will look the same on Test Day as it does in your practice. So you can train the exact routine you will use: menu first, target second, notes always.
Here is your challenge for today. Pull five Graphics Interpretation questions you have already done, from GMAC's official practice materials or anywhere else. Cover the graph with your hand. Read ONLY the sentences and the dropdowns. For each blank, write down what math you expect to do and how exact it needs to be. Then uncover the graph and check yourself. If you called the job right on all five, you just learned to read the menu. If you didn't, now you know exactly what to train.