Graphs and Charts: Read the AXES Before You Read Anything Else

Here's a scene I watch play out every week. A smart Test Taker hits a chart question in Integrated Reasoning. They read the question, glance at the graph, find the tallest bar, do some quick division and pick an answer. It's wrong. Then, in review, they say the words I hear more than almost any others: "I KNEW how to do that."
They're right. They did know how to do the math. The math was never the problem. They never actually READ the chart. They looked at it the way you look at a stranger's vacation photo: for a second, and without caring about the details.
Most chart mistakes on the GMAT aren't math mistakes. They're reading mistakes. And there's a ten second habit that fixes nearly all of them: read the AXES before you read anything else.
Where charts show up, and why they cost you
The current GMAT has an Integrated Reasoning section (IR for short): 12 questions in 30 minutes. A lot of those questions hand you a graph or a table and ask you to pull facts out of it. Now and then a Quant question does the same thing with a small table or chart.
IR isn't part of your 200 to 800 total score, which comes from Quant and Verbal. So some people treat it like a warm up and coast. That's a mistake, and here's why: the habits you build on IR charts are the SAME habits you use on every Quant word problem and every Reading Comprehension passage. Sloppy reading in one section is sloppy reading everywhere. The Two-Part Analysis questions in IR work the same way: they look scary, but the work underneath is simple if you read carefully.
Stop reading for a moment and think about the last chart question you got wrong. Why did you miss it? Don't say "I don't know." Pick an actual reason. I'll bet it wasn't the arithmetic. I'll bet it was a unit, a scale, or a line you matched to the wrong axis.
First, what are the axes?
An axis is one of the edges of a graph that has a scale on it. The horizontal axis runs along the bottom. The vertical axis runs up the side. Some charts have TWO vertical axes, one on the left and one on the right, each measuring a different thing. Every number you read off a graph only means something once you know which axis it belongs to and what that axis is counting.
The ten second habit
Before you look at the question, before you look at a single bar or dot, check these things and WRITE THEM DOWN:
- The title. What is this chart even about?
- Each axis label, including the units. "Revenue" is not enough. Is it dollars, thousands of dollars, millions? Percent?
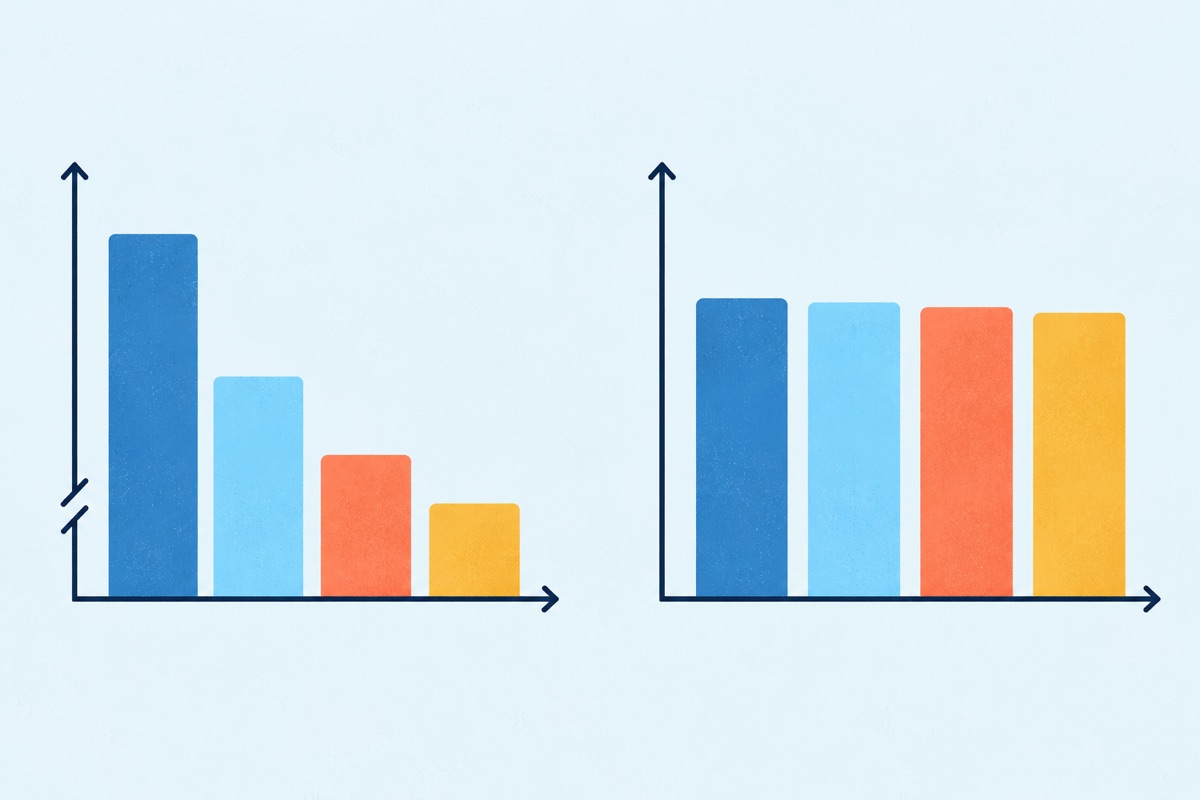
- Where each scale starts. Does the vertical axis start at zero? Often it doesn't.
- The legend. Which shape or color goes with which axis?
Your notes can be tiny. Something like "L: rev, $K, starts 50. R: cust, x100." That's it. Ten seconds. Now every number you pull from the chart comes with its meaning attached.
Try one
Notice what happened there. Neither statement needed hard math. One division, one subtraction, one percent. Every single trap was a READING trap.
The 5 chart mistakes I see most
Reading the question first, then hunting through the chart. You end up grabbing whatever number seems to fit and never learn what the chart is actually measuring.
INSTEAD: Title, axes, units, starting points, legend. THEN the question. Ten seconds up front saves you the minute you'd spend second guessing later.
Ignoring the units in the label. "(thousands)" or "(hundreds)" or "(percent)" is the most important text on the chart, and it's usually the smallest.
INSTEAD: Write the units next to each axis in your notes, every time, even when it feels obvious. Especially when it feels obvious.
Trusting bar heights when the axis doesn't start at zero. Your eyes compare heights. The test compares values. Those are NOT the same thing.
INSTEAD: Never compare by looking. Read the actual value at the top of each bar and do the math on paper.
Matching a line to the wrong axis on a two axis chart. A dot sitting at the "80" height on the left scale might be a 20 on the right scale.
INSTEAD: Use the legend to tag each shape with L or R in your notes before you read a single value.
Doing the conversion in your head. "Thousands divided by hundreds, so that's... times ten?" That's how $60 becomes $600.
INSTEAD: Write out the full numbers: $120,000 and 2,000 customers. Then divide. It takes five extra seconds and removes the whole category of mistake.
"I don't have time for that"
Yes, you do. With 12 questions in 30 minutes, IR gives you an average of 2.5 minutes per question. Ten seconds is a small slice of that. And here's the part people miss: skipping the setup doesn't SAVE time. It moves the time to the end, when you're staring at four answer choices that all look possible, rereading the chart, guessing. That's why a pacing problem is almost never a speed problem. It's a process problem, which is exactly what we dig into in defining your pacing problem.
The same goes for the urge to skim. If you think you can glance at a chart and "just get it," read why pretending to be a speed reading superhero backfires. The GMAT rewards people who read every word that matters ONE time, carefully, and then act.
So you have to decide what you want MORE: to feel fast, or to keep the point?

Your move, today
Pull up five chart or table questions you've already done, from IR practice or anywhere in the official practice materials. Redo them. Before you read each question, write down the title, every axis label with its units, where each scale starts, and what the legend matches to which axis. Then answer.
Now compare your notes to what you did the first time. For every one you missed originally, name the exact reading step you skipped. If the list is longer than you expected, good. You just found points you were giving away, and you can take them back starting with the very next chart you see.